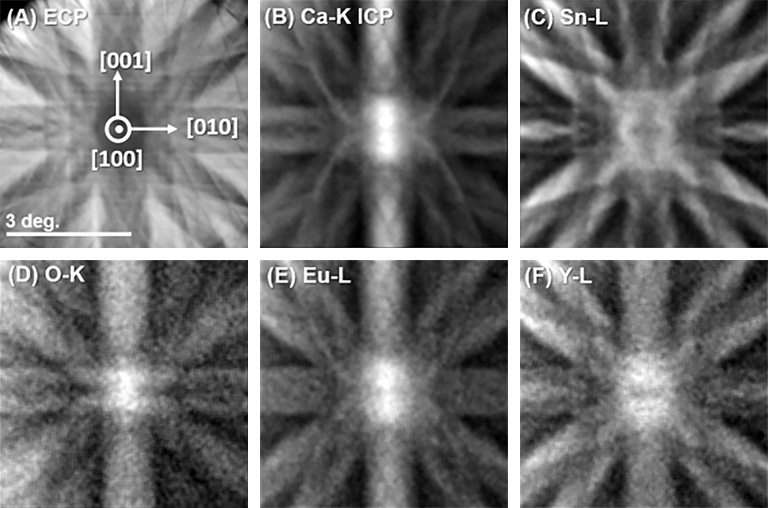
ECP and corresponding X-ray ICPs from Ca1.8Eu0.2Y0.2Sn0.8O4 by beam-rocking near the [100] zone axis. (A) ECP. (B-F) ICPs of Ca-Ka, Sn-L, O-Ka, O-Ka, Eu-L, and Y-L emissions, respectively.
Figure shows the ECP and ICPs of Ca-K, Sn-L, O-K, Eu-L, and Y-L for the Ca1.8Eu0.2Y0.2Sn0.8O4 sample near the [100] zone. The Eu-L ICP was closer to the Ca-K ICP, whereas the Y-L ICP was closer to Sn-L ICP. This suggests that the Eu and Y occupation sites could be biased, as expected. The coefficients, αix for i = Ca, Sn, and x = Eu, Y derived using Eq. (1), where nCa = 2/3 and nSn = 1/3. The k-factors of the constituent elements are calibrated in advance using a reference material with a known composition.. The site occupancies fix of the impurities, and the impurity concentrations c of all the samples are tabulated in Table 1.
In Ca1.9Eu0.2Sn0.9O4, Eu3+ occupied the Ca2+ and Sn4+ sites equally, consistent with the results of the XRD-Rietveld analysis. In contrast, Eu3+ and Y3+ occupied the Ca2+ and Sn4+ sites at ratios of approximately 7:3 and 4:6, respectively, in the co-doped samples, significantly biased as expected, but also maintaining the charge neutrality condition within the present experimental accuracies.
| Sample | Dopant | aCa | aSn | fCa | fSn | cx(x = Eu or Y) |
|---|---|---|---|---|---|---|
| Ca1.9Eu0.2Sn0.9O4 | Eu | 1.71±0.001 | 0.083±0.001 | 0.57±0.001 | 0.43±0.002 | 0.061±0.001 |
| Ca1.9Eu0.2Sn0.9O4 | Eu | 0.162±0.001 | 0.077±0.001 | 0.78±0.003 | 0.22±0.008 | 0.088±0.004 |
| Y | 0.040±0.0012 | 0.265±0.009 | 0.28±0.002 | 0.72±0.001 | 0.118±0.004 |
Table 1. Derived parameters (defined in text) of the samples of Ca2-xEuxSn1-vYvO4 where (x, y) = (0.2, 0.0) and (0.2, 0.2).